Hi Guys
I am still trying to get my head around embeddings.
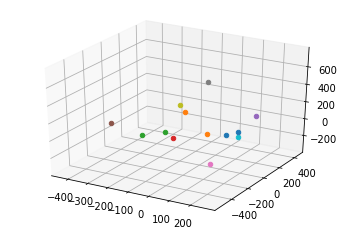
In the code below I created embeddings for a list of (test)strings of whch some are identical. But the resulting plot shows a distribution of the embeddings that I dont quite understand - I would have at least expected a cluster of points of the identical strings.
What am I missing?
from openai.api_resources import embedding
import matplotlib.pyplot as plt
import os
import openai
from sklearn.manifold import TSNE

openai.api_key = "■■■■■■■■■■■■■■■■■■■■■■■■■■■■■■■■■■■■■■■■■■■fXJq5Aph"

input_strings=[
  "king",
  "queen",
  "castle",
  "castle",
  "castle",
  "castle",
  "castle",
  "castle",
  "castle",
  "rocket",
  "moon",
  "accountant",
  "finance"
]


def get_embeddings(strings):
  count=0
  return_list=list()
  for string in strings:
    response = openai.Embedding.create(
      model="text-search-ada-doc-001",
      input=string
    )
    embeddings=response['data'][0]['embedding']
    #print(embeddings)
    return_list.append(embeddings)
  return (return_list)


embeddings_list=get_embeddings(input_strings)

tsne = TSNE(n_components=3)
reduced_embeddings = tsne.fit_transform(embeddings_list)

# create a figure and axis

fig = plt.figure()
ax = fig.add_subplot(111, projection='3d')
# loop through the list of reduced-dimensional embeddings
for embedding in reduced_embeddings:
    # plot the 2D embedding on the axis
    ax.scatter(embedding[0], embedding[1], embedding[2])

# show the plot
plt.show()
