Hi, I’m trying to use gpt4o to extract data from tables and graphs inside images, but the output is very stochastic, having each time a different result, what is the better prompting strategy to get the data points from an image with a table or a chart?
Hi and welcome to the developer forum!
If the input images are consistent, then you can try specifying a json object structure in your prompt that contains the information you wish to extract in a standard format, like an example. "From this image extract the current sales figures and put them in a json structure like so
{
  "monthly_sales": [
    {
      "month": "January",
      "year": 2024,
      "total_sales": 150000,
      "breakdown_by_category": {
        "electronics": 50000,
        "furniture": 30000,
        "clothing": 40000,
        "groceries": 20000,
        "others": 10000
      }
    },
    {
      "month": "February",
      "year": 2024,
      "total_sales": 160000,
      "breakdown_by_category": {
        "electronics": 60000,
        "furniture": 25000,
        "clothing": 45000,
        "groceries": 20000,
        "others": 10000
      }
    }
    // Add more months as needed
  ]
}```
"If and when the resolution of the images is large enough the extraction, in my experience works AMAZING. Vision needs to be enabled and I[m talking about gpt-4o. The prompt to use is to ask to create mark down for each page.
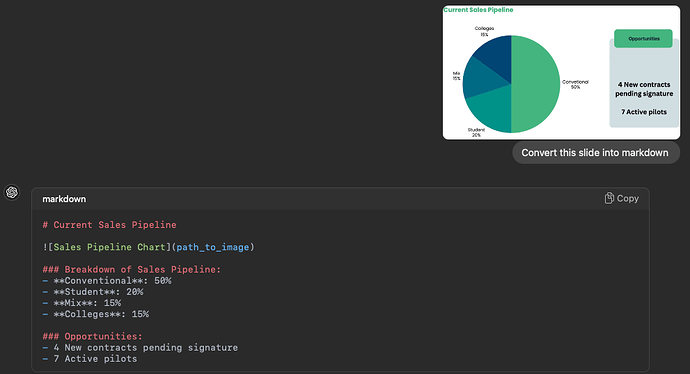
I use this on pitch decks a lot and chart are automatically converted to tables with the data. Here’s an example :
Prompt: Convert this slide into markdown
Current Sales Pipeline
Breakdown of Sales Pipeline:
- Conventional: 50%
- Student: 20%
- Mix: 15%
- Colleges: 15%
Opportunities:
- 4 New contracts pending signature
- 7 Active pilots
If you check that you can read the numbers clearly when zooming in they should also be converting fine. gpt-4o with vision.
hi @Foxalabs , it is not consistent, each image is different
the graph is a small portion of the image, so maybe I will have to automate the detection of the graphs/tables and to cut the image, and then use only that part of the image, thanks @jlvanhulst for the idea
Maybe you could have a tool that pre-processes images like playing with contrast, and converting to B/W and cropping it for increased visibility and then pass in the enhance image to create runs.
Honestly the you should be able to
Handle with a prompt. Feel free to share examples!
Hi, check out graph2table, it extracts the underlying tabular data from images of graphs/plots/charts with good accuracy

